2023 NEO Database
Compiled for University of Tasmania Radar Observations
Object Designation : the NEO's permanent number, name and provisional designation (in that order).
CA Date : the date and time (TDB) of close approach, with uncertainty.
RCS Approximation : ~17% of the spherically approximated Radar Cross Section value of the NEO. This percentage was determined from the mean difference between NEOs' RCS approximation and true value when known.
CA Distance : the most likely Earth close-approach distance.
Diameter : either a diameter range approximated using each NEO's absolute magnitude and an albedo range of 0.25 to 0.05, or the diameter value if known.
Magnitude (H) : the absolute magnitude of the asteroid.
SNR : the calculated signal-to-noise ratio for the Hobart 12m Radio Telescope based on the approximated RCS using the Radar Range Equation and an assumed 1 hour of integration time. Entries only included for NEOs with calculated SNRs greater than 1.
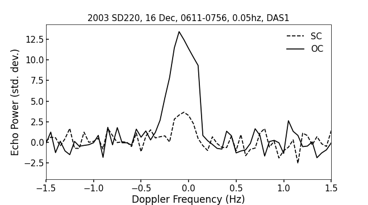
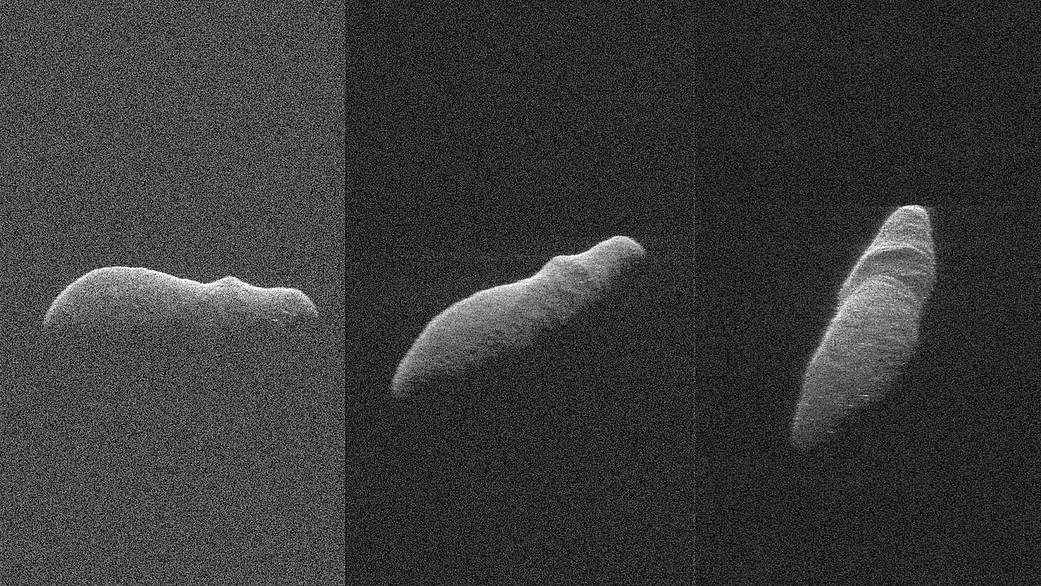
Results : contains links to any results including images or spectra.
Click on any of the titles to arrange the database in alphabetic or numeric order
| Object Designation | CA Date | RCS Approximation (m2) | CA Distance (AU) | Diameter | Absolute Magnitude (H) | SNR | Results |
|---|---|---|---|---|---|---|---|
| 367789 (2011 AG5) | 2023-02-03 08:51 ± < 00:01 | 1642 | 0.01215 | 110 m - 250 m | 21.9 | 14.24 | |
| 199145 (2005 YY128) | 2023-02-16 00:46 ± < 00:01 | 44091 | 0.03073 | 570 m - 1.3 km | 18.4 | 9.35 | |
| (2020 DG4) | 2023-02-17 22:42 ± 4_08:56 | 5 | 0.00369 | 6.1 m - 14 m | 28.2 | 5.15 | |
| 436774 (2012 KY3) | 2023-04-13 19:08 ± < 00:01 | 39572 | 0.03198 | 540 m - 1.2 km | 18.5 | 7.15 | |
| (2006 HV5) | 2023-04-26 03:43 ± < 00:01 | 7241 | 0.01618 | 307 ± 0.076 m | 19.7 | 19.97 | |
| 488453 (1994 XD) | 2023-06-12 00:53 ± < 00:01 | 18578 | 0.02114 | 370 m - 820 m | 19.3 | 17.58 | |
| (2020 DB5) | 2023-06-15 02:05 ± < 00:01 | 18578 | 0.0288 | 370 m - 820 m | 19.3 | 5.10 | |
| (2018 UY) | 2023-07-12 15:58 ± < 00:01 | 4397 | 0.01904 | 180 m - 410 m | 20.8 | 6.32 | |
| (2020 UQ3) | 2023-07-18 09:59 ± 12:52 | 275 | 0.00801 | 45 m - 100 m | 23.9 | 12.62 | |
| (2014 QL433) | 2023-08-04 10:05 ± < 00:01 | 10639 | 0.03575 | 280 m - 620 m | 19.9 | 1.23 | |
| 6037 (1988 EG) | 2023-08-23 08:19 ± < 00:01 | 23939 | 0.04065 | 420 m - 940 m | 19 | 1.66 | |
| (2016 LY48) | 2023-09-17 21:38 ± 3_11:05 | 805 | 0.01113 | 77 m - 170 m | 22.7 | 9.91 | |
| (2009 UG) | 2023-09-30 13:26 ± < 00:01 | 457 | 0.0157 | 58 m - 130 m | 23.3 | 1.42 | |
| 349507 (2008 QY) | 2023-10-03 20:39 ± < 00:01 | 36695 | 0.04228 | 520 m - 1.2 km | 18.6 | 2.17 | |
| (2011 GA) | 2023-10-15 07:09 ± < 00:01 | 4397 | 0.01744 | 180 m - 410 m | 20.8 | 8.98 | |
| (1998 HH49) | 2023-10-17 00:33 ± < 00:01 | 2660 | 0.00784 | 140 m - 320 m | 21.3 | 133.09 | |
| (2019 HH4) | 2023-10-24 10:46 ± < 00:01 | 9893 | 0.03396 | 270 m - 590 m | 20 | 1.41 | |
| 302169 (2001 TD45) | 2023-10-26 23:00 ± < 00:01 | 10639 | 0.03258 | 280 m - 630 m | 19.9 | 1.79 | |
| 525229 (2004 UU1) | 2023-10-30 10:41 ± < 00:01 | 3053 | 0.02725 | 150 m - 330 m | 21.3 | 1.05 | |
| 363505 (2003 UC20) | 2023-11-02 15:49 ± < 00:01 | 458950 | 0.03511 | 1876 ± 37 m | 18.5 | 57.09 | |
| 164121 (2003 YT1) | 2023-11-03 12:33 ± < 00:01 | 184818 | 0.05936 | 1717 ± 550 m | 16.3 | 2.81 | |
| (2019 UT6) | 2023-11-24 07:46 ± < 00:01 | 1642 | 0.02315 | 110 m - 240 m | 22 | 1.08 | |
| (2019 CZ2) | 2023-11-25 19:49 ± 6_10:07 | 139 | 0.00717 | 32 m - 71 m | 24.6 | 9.94 | |
| (2013 VX4) | 2023-12-04 16:38 ± < 00:01 | 263 | 0.01309 | 44 m - 99 m | 23.9 | 1.69 | |
| 139622 (2001 QQ142) | 2023-12-06 21:00 ± < 00:01 | 38120 | 0.03694 | 530 m - 1.2 km | 18.5 | 3.87 | |
| (2020 YO3) | 2023-12-23 20:28 ± 5_03:44 | 130 | 0.00912 | 31 m - 70 m | 24.7 | 3.56 |
Sources from which this database was compiled:
- Center for Near Earth Object Studies NEO Earth Close Approaches database (JPL).
- JPL Small-Body Database Lookup.
- Johnston's Archive Radar-detected asteroids with radar-measured parameters.

